

The top 27 essential HR metrics to track


Jonathan Davies
16 mins read
A company's employees are its greatest asset, making human resources metrics crucial to its success. If you’re not monitoring people metrics in your company, you may be at risk of high turnover rates, losing key talent, and paying higher costs per employee.
While over 71% of companies consider HR analytics important, effective adoption has been slow, with only 59% of employees rating their well-being at work as 'good' or 'excellent.'
HR measurement is no longer just nice to have — it’s essential if organizations want to keep their best employees. This guide will explore HR metrics and analytics and the 27 HR metrics you should track to attract and retain top talent.
What are HR metrics and analytics?
HR metrics, or people metrics, are a set of data points that give organizations insight into various aspects of a workforce. Ideally, HR metrics should combine quantitative and qualitative measures.
Qualitative metrics measure employees' attitudes, including job satisfaction and engagement. Quantitative metrics measure the efficiency of processes and include factors such as absenteeism and turnover rates. Both types of metrics are essential for measuring the success of HR initiatives.
Many tools and technologies are available to assist HR teams in monitoring, measuring, and analyzing metrics. But how do you decide which metrics are most important, how do you track them, and what do you do with the data? We’ve gathered the top metrics every company should track, broken down into categories.
27 important HR metrics to track (by category)
- Recruitment metrics
- Productivity and performance metrics
- Retention metrics
- Training and development metrics
- Diversity, equity, and inclusion (DE&I) metrics
- Advocacy and wellness metrics
Recruitment metrics
A smooth recruitment process allows HR teams to hire better talent faster. The following metrics can help you assess and optimize your recruitment process to attract the right people for your open roles.
Time-to-hire
Time-to-hire is the average number of days it takes between a candidate applying for a job and when they accept the offer. This is different from the time-to-fill metric which is the average number of days it takes between the approval of a job requisition and when a candidate accepts the offer.
Both of these metrics are great resources for business planning. They offer a realistic perspective for managers to accurately account for the time it takes to fill a new role or hire a replacement after a departing employee.
The average length of recruitment spans 36 to 42 days. Considering that most good candidates are off the market in under 10 days, it’s good practice to reduce your time-to-hire and time-to-fill processes as much as possible.
Cost-per-hire
Cost per hire = [Internal recruitment costs + external recruitment costs] / total number of hires
Cost-per-hire is the average cost of hiring a new employee. In 2023, the average cost of a new hire increased to $4,700 (up from $4,000 only a few years prior). Not to mention that costs to hire executives and leaders are 3 or 4 times higher than the overall average cost per hire.
To calculate your organization’s cost-to-hire metric, add all the internal and external costs associated with hiring and divide by the total number of employees you hired over the same period.
First-year attrition rate
First-year attrition rate = (number of employees who left in the first year) / (total number of employees hired in the same year) x 100
The first-year attrition rate, sometimes called “new hire turnover,” is a crucial recruiting metric tracking the success of each new hire. You can also break down this metric into voluntary or involuntary attrition.
- Involuntary attrition: This occurs when the employer terminates a contract. It indicates low productivity, poor performance, or a bad fit with the team.
- Voluntary attrition: In this case, an employee leaves independently. It could indicate a bad first-year experience, misaligned expectations, poor company culture, or a bad fit with the team.
Given the high costs associated with recruitment, the longer an employee remains with the company, the greater the return on investment will be.
Employee growth rate
Growth rate = [(number of employees in current period - number of employees in previous interval) / (average number of employees x total workdays ] x 100
Measuring employee growth can help companies understand their growth patterns and better plan finances and expansion opportunities. To calculate your organization’s growth rate, you’ll need to keep track of the total number of employees in your organization (or within a specific department) over time.
Offer acceptance rate
Offer acceptance rate = number of offers accepted / number of offers made
The offer acceptance rate measures how many offer letters your organization sends compared to how many were accepted by candidates. Divide the number of letters sent by the candidates who accept to calculate this metric.
Productivity and performance metrics
Organizations conduct annual performance reviews for all employees, but do they take a step back to assess the bigger picture? The following performance metrics can reveal underlying problems and improve productivity.
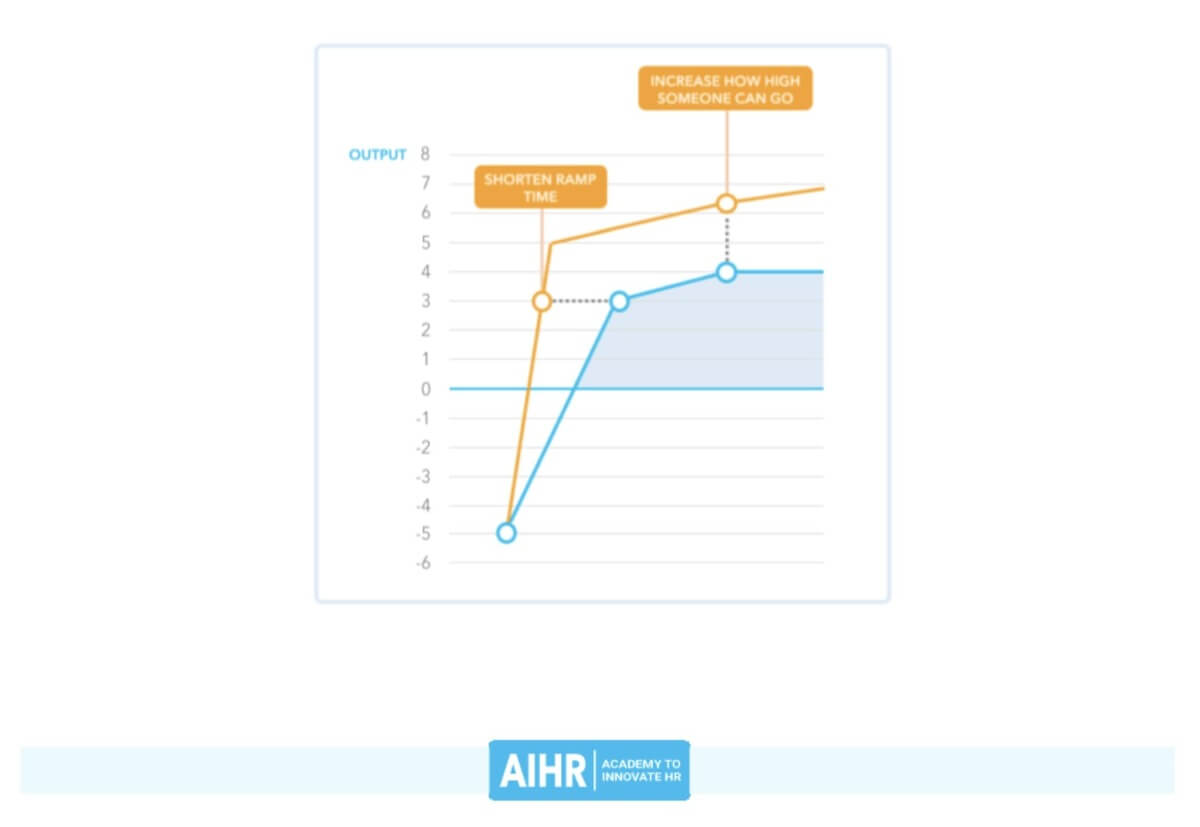
Time-to-productivity
Time-to-productivity refers to the time a new hire takes to start working confidently and at full capacity. The time to onboard new employees and train them for their roles varies from role to role and organization to organization.
On average, it can take between three to eight months for a new hire to settle in and become fully productive. The shorter the ramp time, the more profitable that employee becomes for an organization.
Utilization rate
Employee utilization rate accounts for the time each employee works on billable tasks. This is one of the most concrete ways to quantify performance, and it’s most frequently used by professional service firms, consultancies, and agencies.
Combining this metric with qualitative indicators of employee satisfaction can lead to interest connections. For example, employee engagement or satisfaction can positively or negatively affect the utilization rate. By making such correlations, you can uncover deeper causes of poor productivity within and across each department.
Revenue per employee
Revenue per employee = total revenue / total number of employees
Tracking the revenue per employee indicates the workforce's efficiency as a whole. It can also indicate the quality of employees and justify decisions around hiring new team members.
Profit per employee
Profit per employee = (revenue - operational costs) / total number of employees
or
Profit per employee = total profit / total number of employees
Calculate your profit per employee by subtracting all organizational costs from the total revenue, then dividing by the number of employees.
Performance ratings
Performance ratings can be subjective and are usually measured by survey responses. You can look at performance ratings within your organization in a few ways:
- Employee performance: You can track individual employee performance through self-assessments, manager assessments, peer reviews, or a combination of all three methods.
- Company performance: You can take a high-level, holistic view of how well all employees perform and compare it to how appreciated and motivated teams are.
- Individual goal tracking: If you use performance management software, you may also be able to track goals for each employee and connect these to company goals.
Internal promotion rate
Internal promotion rate = [(number of internal promotions) / (total number of people who started a new role in the same time period)] x 100
Individual promotion rate = average time (in months) since an individual’s last promotion.
Keeping track of your company’s internal promotion rate lends valuable insights into:
- Why top talent may be leaving the organization
- The level of motivation employees feel
- Productivity patterns, particularly a decline in performance
Successful employee development leads to higher levels of job satisfaction and retention. You can calculate internal promotion rates at a company-wide and individual level.
Absenteeism rate
Absenteeism rate = (total number of work days missed due to illness / number of permanent employees
The term absenteeism refers to how frequently employees use sick leave without prior approval. A high absenteeism rate could indicate low motivation levels across your workforce. It also provides clues to the health and happiness of employees. If you choose to track this metric per manager, it can also provide insight into the relationships each manager has with their direct reports.
A high absenteeism rate can be an early warning sign linked to high turnover. Ideally, your absence rate should be as close to zero as possible.
Retention metrics
Employee retention levels are often the most significant warning that something is amiss within a workplace. Keeping your top people employed longer ensures greater profitability per employee. Here are some key metrics to measure retention.
Employee turnover rate
Employee turnover rate = [number of employees who have left the organization over a period / total number of employees in the organization at the start of that period] x 100
Employee turnover rate measures how many people leave an organization in a given time period. There are many different ways you can measure this HR metric:
- New hire turnover: The number of new hires who leave within a set period of time.
- Top talent turnover: The number of high-performing employees who leave the organization in a set time period.
- Total turnover: The number of employees who have left the organization in a set time period.
You can also further segment these metrics based on whether these employees left voluntarily or not.
- Voluntary turnover: The turnover rate of employees who left of their own accord.
- Involuntary turnover: The number of contracts the organization terminated.
Average cost of employee turnover
Average turnover cost = sum of costs associated with turnover / total number of employees who leave the company
There are many costs when an employee leaves, either of their own choice or through termination. Costs vary by company and department, but you can generally consider the cost of severance, productivity lost while the position is unfilled, and the cost of recruitment among the most common turnover costs.
Exit reasons
Identifying how many people have left is important, but figuring out why they are leaving is equally essential. You can track this qualitative metric by asking departing employees to complete an exit survey before leaving or gather insight through employee exit interviews. These opportunities allow them to state their reasons for resignation and provide additional insights.
Employee retention rate
Employee retention rate = 100% - employee turnover rate
or
Employee retention rate = [number of employees from the original cohort who are still employed / total number of employees in the organization at the start of that period] x 100
The employee retention rate is the opposite of the turnover rate. Instead of looking at the number of employees who have left the organization, you look at the number who were with the organization both at the start and the end of the time period you’re tracking against.
For example, you can take stock of all the employees at the start of the year and then count those who remain employed at the end, disregarding any new hires in between.
Average tenure period
Average tenure period = total number of months or years a cohort has been employed / number of employees
An employee’s tenure period measures how long they stayed with the organization in months or years.
Training and development metrics
Offering career development pathways can be a great source of motivation for many people, allowing you to retain top talent longer. The following metrics evaluate the time and effectiveness of training employees.
HR initiative completion rate
Initiative completion rate = number of employees who completed the training / total number of employees
You can measure the number of people — and the average time it takes them — to complete a training program or HR initiative.
With tools like Happeo, you can also automatically measure employee engagement at specific points within a training module by analyzing the page analytics within your intranet.
Total training costs
Training employees involves several direct and indirect costs. You’ll need to keep track of hard costs like the cost of specific training programs and soft costs like the reduction in productivity while employees are in training.
Training cost per employee
Training cost per employee = total training costs / number of employees
Once you have calculated the total training costs of the organization, divide this figure by the number of employees to work out the cost of training per employee.
Diversity, equity, and inclusion (DE&I) metrics
Diversity is crucial not only to a successful team but also to an organization's employee satisfaction. You can create a robust strategy for a competitive workplace attractive to diverse, talented candidates by measuring the following demographic metrics.
Internal pay gap
Internal pay gap = [(Average salary of group 1 - Average salary of group 2) / Average salary of group 1] x 100
The gender pay gap remains a global issue with women earning $0.82 on the dollar compared to men in the United States. Race or ethnicity pay gaps are also present and vary in severity.
It’s becoming more critical for modern workplaces to eliminate pay discrepancies based on gender, race, or other demographics. To measure the gap within your organization, you can compare the salary averages of two different groups.
Salary penetration rate
Salary penetration rate = [(salary - range minimum) / (range maximum - range minimum)] x 100
The salary penetration rate considers an employee's salary compared to the standard pay range in the employment market at any given time. Looking at salary penetration can help you close pay gap issues. Auditing employee salary ranges and closing compensation gaps where possible is recommended.
Gender diversity ratio
Gender diversity ratio = Number of employees identifying as men : number of employees identifying as women : number employees identifying as non-binary : number of employees identifying as other
You can measure the gender diversity of your teams, applicant pool, or candidates by using a ratio. Organize your employees into groups based on their declared gender and then divide them down to the smallest number.
Ethnic diversity ratio
Using the same formula above, you can calculate the ratio of different ethnicities within your applicant pool or among your employees.
Advocacy and wellness metrics
Measuring and understanding your team's health and wellness is as important as keeping track of any other company metric. An effective people operations team measures qualitative metrics to better understand their employees.
Employee satisfaction
Employee satisfaction refers to the number of employees satisfied with their employee experience. You can also track candidate job satisfaction to ensure job descriptions and onboarding processes are accurate and aligned with candidate expectations. Surveys are a common way to measure satisfaction levels.
Employee Net Promoter Score (eNPS)
GeNPS = [(number of promoters - number of detractors) / number of respondents] x 100
Employee Net Promoter Score (eNPS) is a metric that measures the likelihood of an employee recommending a company to his or her friends and colleagues.
eNPS is easy to track with a simple survey asking employees to rate their company on a scale of 0 to 10. Their answer determines which category they fall into:
- 0 – 6: Detractors
- 7 – 8: Passives
- 9 – 10: Promoters
Then, just tally the number of employees in each category and calculate your eNPS score using the formula. A score over 40 is considered outstanding though 20-30 is also acceptable.
*Net Promoter, NPS, and the NPS-related emoticons are registered trademarks, and Net Promoter Score and Net Promoter System are service marks, of Bain & Company, Inc., Satmetrix Systems, Inc. and Fred Reichheld.
Employee referrals
Keeping track of the number of new hires generated by current or former employees is a great way to determine which recruitment channels are most effective. Many HR teams encourage existing employees and alumni to contact their networks to fill open positions because referrals are usually the most affordable recruitment method.
3 steps to get the most value from your HR metrics
An HR metrics program is a valuable tool, but it won't be effective unless accompanied by action. The people operations team needs to analyze KPI insights and communicate the results to employees to develop plans to solve common workplace problems.
Here’s a simple process you can start with to get the most value from your HR metrics.
1. Align metrics with your HR goals
Not all the metrics listed above will be valuable for every organization. It’s unnecessary to track things you won't use, nor do you want to miss the most important things. Before you begin tracking, ensure the metrics you select align with HR and company goals.
2. Analyze qualitative and quantitative metrics
Next, ensure you include a healthy mix of qualitative and quantitative metrics. Although quantitative metrics are easier to capture and offer the numbers many leaders desire, qualitative metrics can offer your HR department valuable insight into the root causes of workplace problems.
3. Act on the findings
Finally, take action on the insights you gather. When you uncover patterns that affect employee turnover, engagement, productivity, or motivation, it’s ultimately up to you to find the appropriate solution and act on it. And don’t stop tracking — monitor HR metrics regularly to observe changes in high-risk metrics.
Which HR metrics are you tracking?
If you’re already tracking HR metrics, well done! If you’re new to tracking HR metrics, we hope this list of the 27 best metrics will give you a great place to start.
You can simplify HR metrics measurement and tracking by transitioning your company intranet to Happeo. We’ve helped thousands of organizations measure (and boost) employee engagement and productivity by consolidating internal communications, information, and analytics into one easy-to-use tool.
With our innovative platform, all of your organization's tools are connected. Through a single, integrated search bar, employees can enjoy the ease of accessing all tools and information in one place, keeping them focused during complex tasks. HR departments can now track how and when work is done even in remote and hybrid workplaces.
Join hundreds of teams and improve your HR measurement effort in less than 6-8 weeks with Happeo.