


Internal Communications Expert insights
A beginners guide to using Google Analytics 4 to evaluate your intranet’s performance

Jonathan Davies
4 mins read
This article is for Google Analytics 4 beginners and covers the most helpful reports on user behavior in your Happeo intranet, which help you better understand your intranet performance.
If your Happeo intranet is not connected to Google Analytics yet, follow the instructions to connect your accounts here.
We’ll cover two areas of a default Google Analytics 4 report, i.e.:
- How to access the report and which metrics to look at
- The insights or conclusion that can be drawn from existing reports
Always select the date range you’d like to look at first. You can do so in the top right corner. If you want, you can also compare different date ranges to each other.
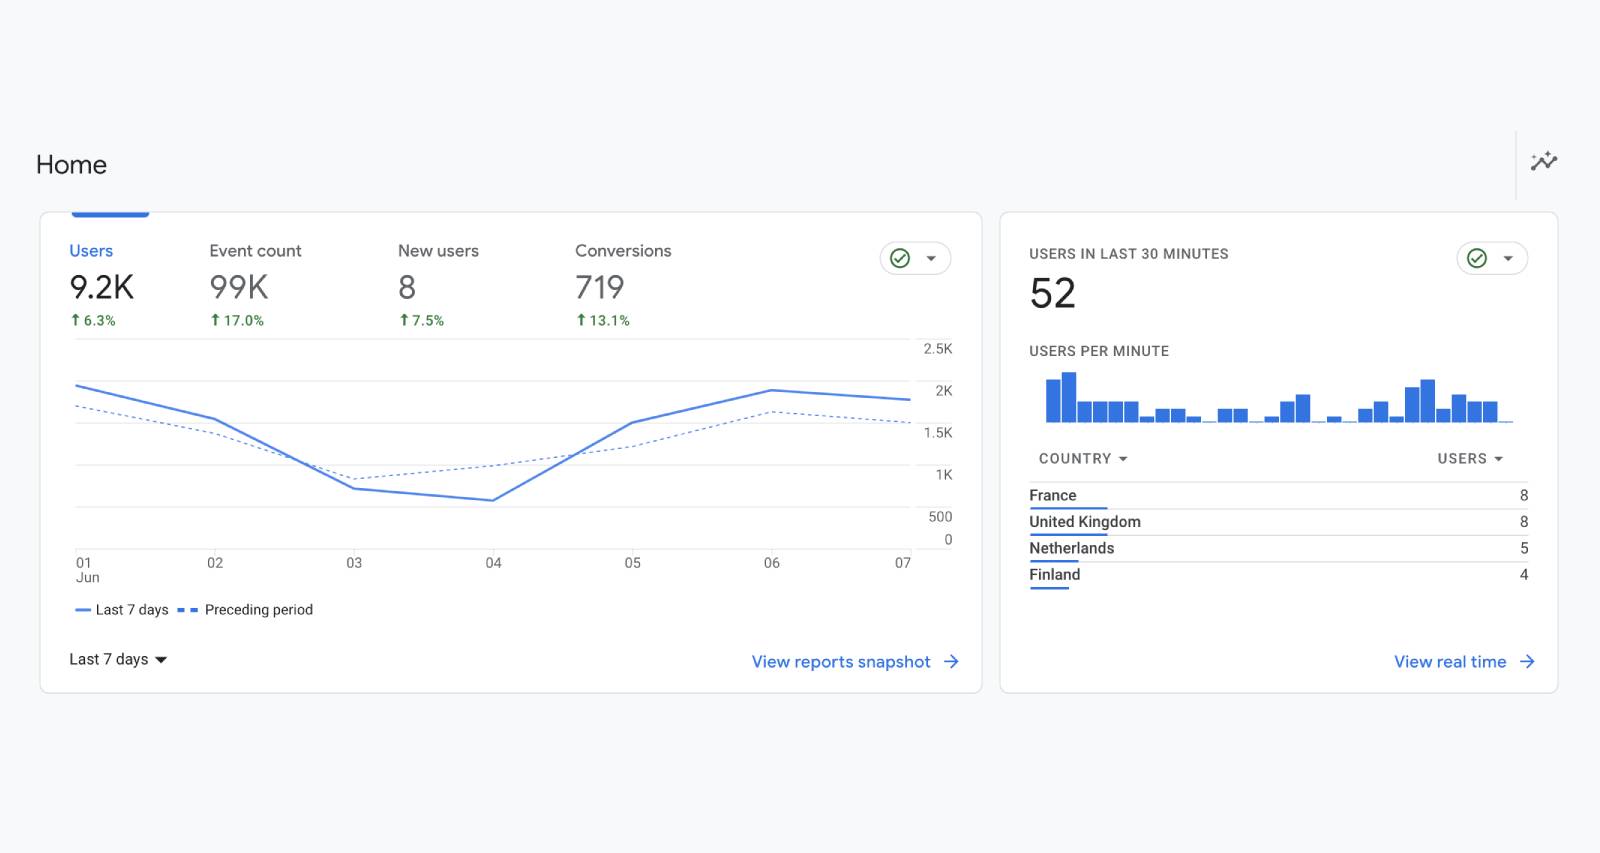
Understand your Happeo intranet’s usage
How to access this report: Reports -> Report snapshots
What this report tells you: This Report gives information about the users that visit any page in your Happeo intranet. The Overview is a dashboard featuring the most important data. If you'd like see more details, just click on the link below the graphs.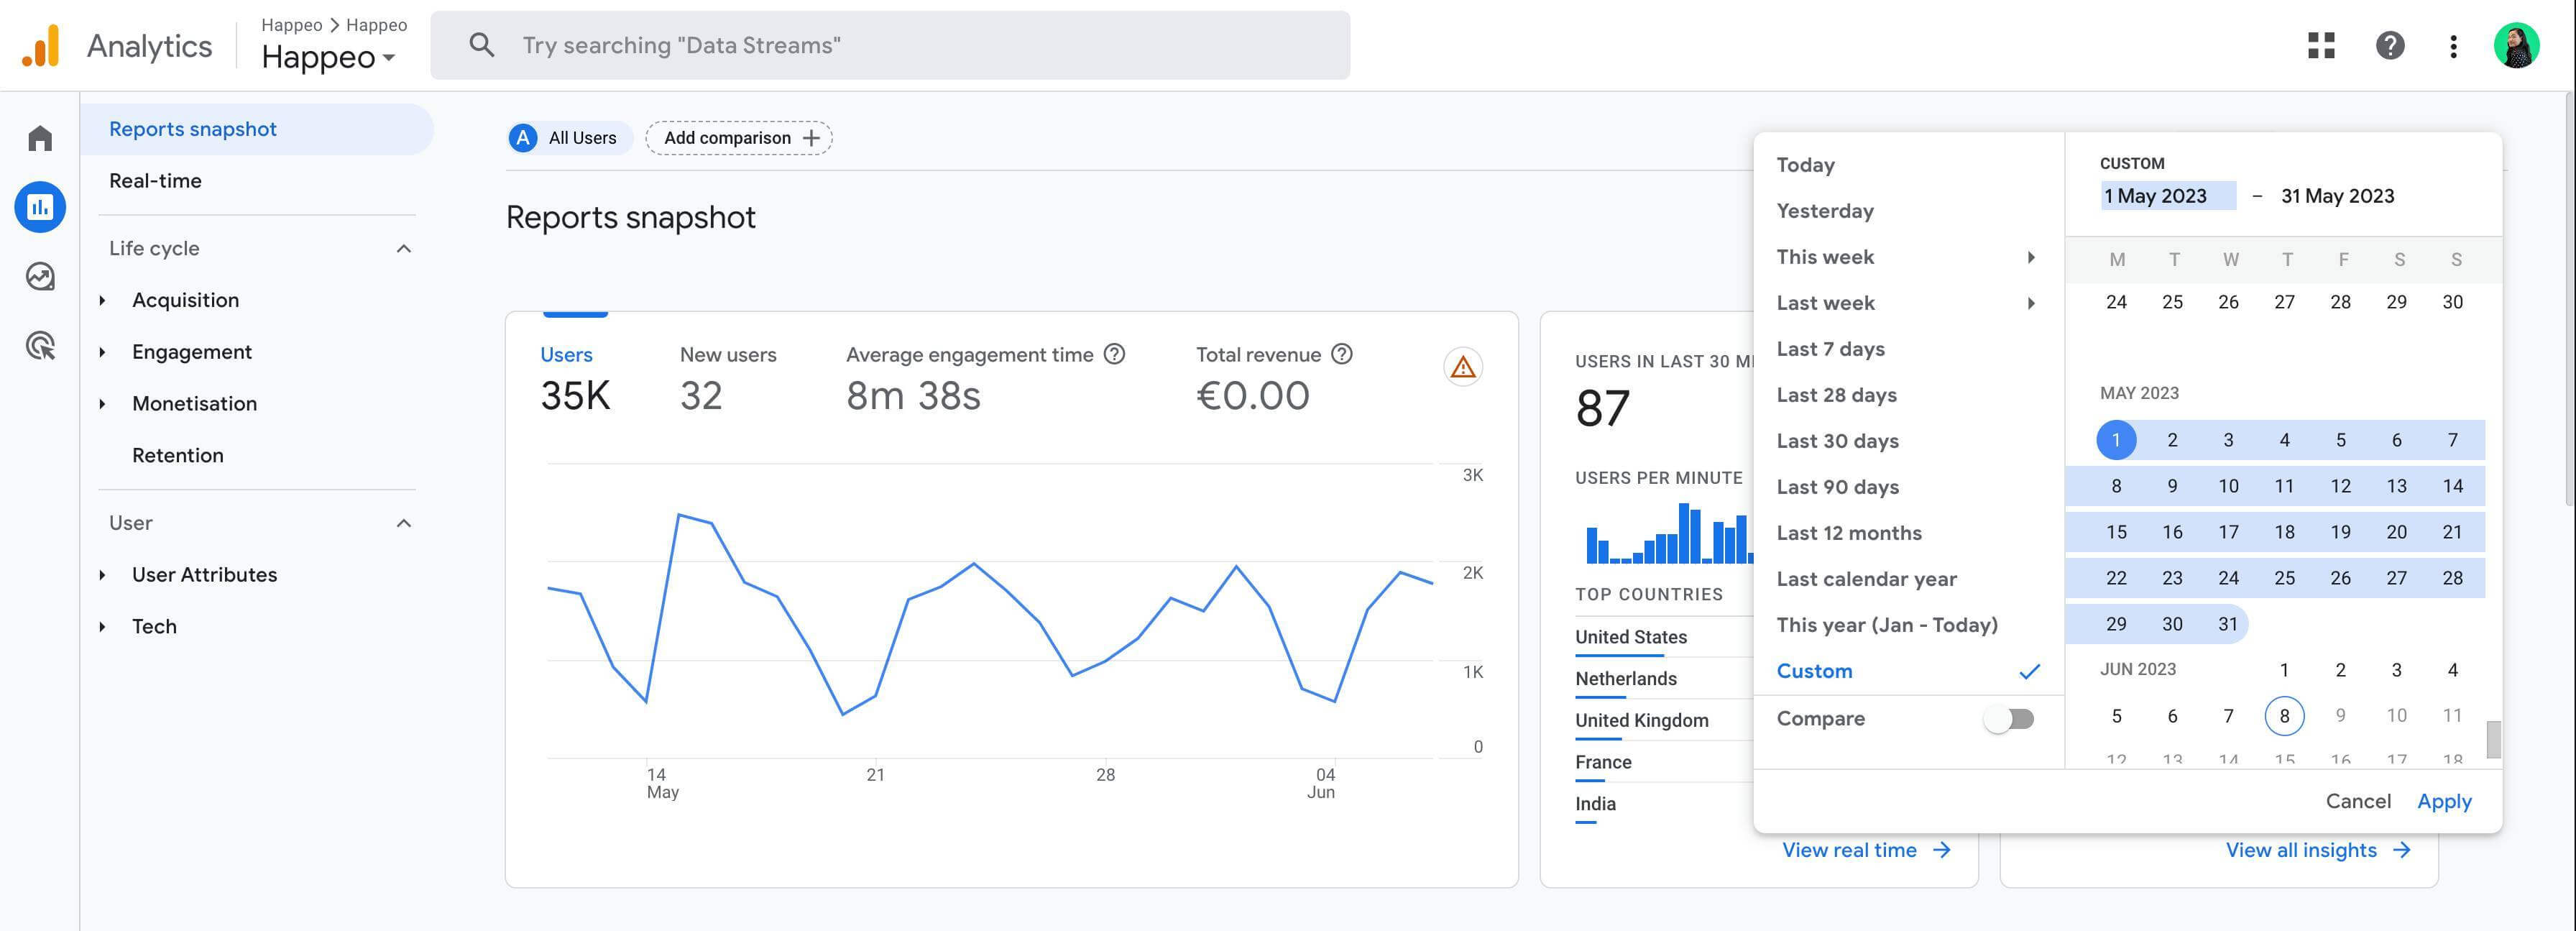
Key metrics in this report:
- Users: This metric tracks the total number of logins from both existing and new users.
- Events: This metric measures specific interactions, such as page views or link clicks.
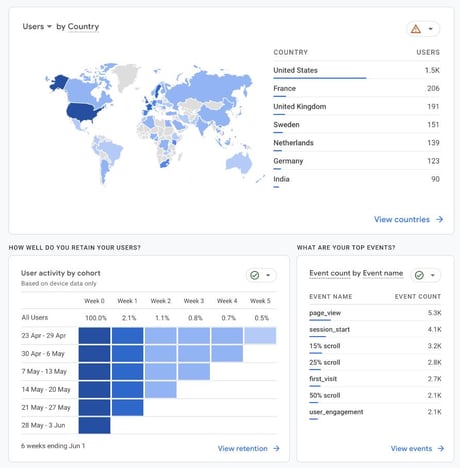
What this report can answer:
- Are the users engaged when they visit Happeo?
- What time of the day does the portal get maximum traffic?
- Are the users spending enough time in the application?
- What demographic or system do your users use?
- What is the browser language of the users?
- Are more employees using the intranet each month?
- Are they visiting more pages each visit or less?
- Do they spend more or less time in your Happeo portal?
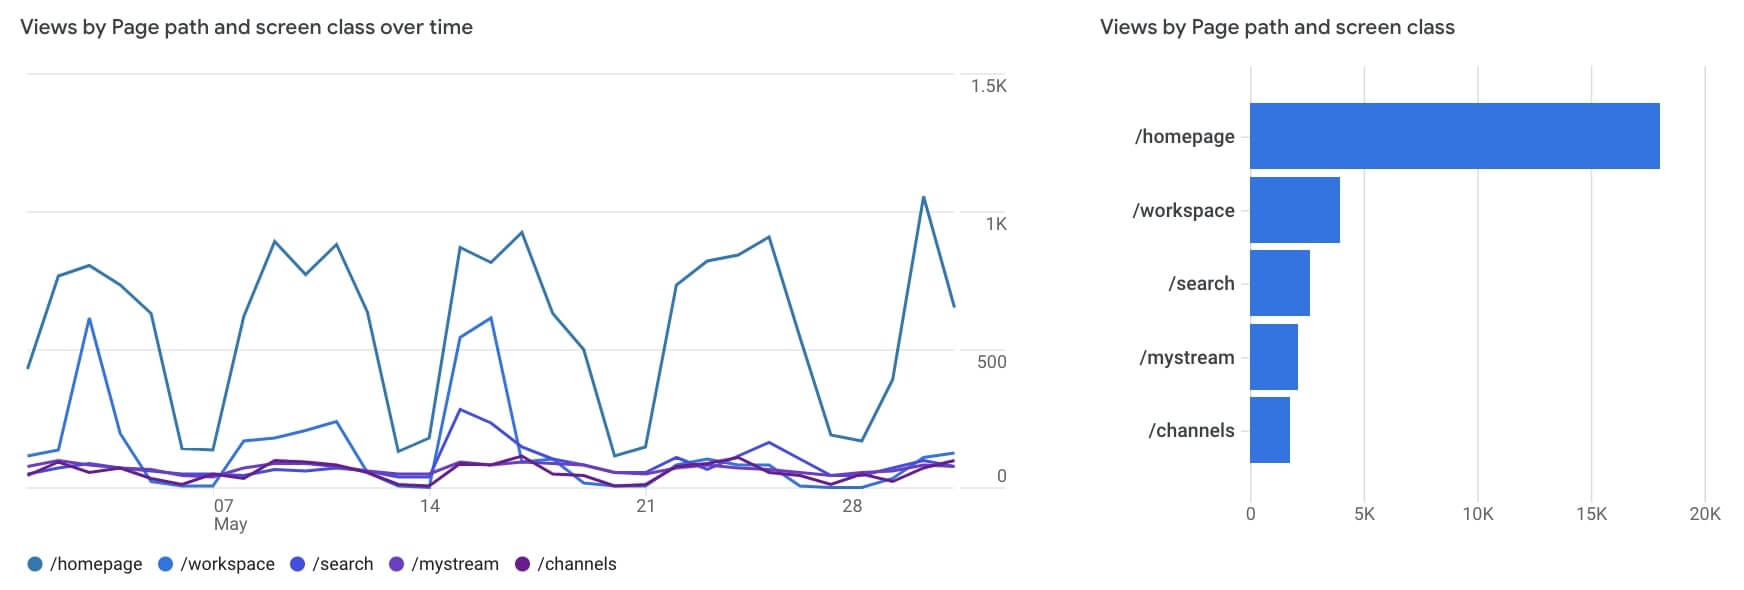
Understand the impact of the Pages in your Happeo intranet
How to access this report: Reports -> Engagement -> Pages and screens
What this report will tell you: This Report tells you which Pages are popular amongst your users.
Key metrics in this report:
- Views: This metric measures the unique visits to each page. If the same user visits the same page six times, the number of views will be counted as six views.
- Average engagement time: This metric measures the average amount of time spent by a user on a page.
In addition to the above metric, another interesting report is the “Path exploration” (Explore > Path exploration). This report tracks the path users take in Happeo from the first page they visit, to the last page they visit before exiting. The “Path exploration” shows how your users navigate through Happeo.
What this report can answer:
- Which Pages receive the most traffic and the least traffic?
- What is the total traffic on your Pages on a given date range?
These are just some basic reports from a wide variety of reports you can create. Learn more about creating custom reports in Google Analytics 4 in this article.
Happeo's Advanced Analytics
This is the real game changer. Happeo’s Advanced Analytics give you access to metrics that make it easy to measure the impact of your internal communications and understand what really matters to your people. Happeo’s Advanced Analytics dashboard gives you an overview of:
- Top searched keywords
- Total searches
- Unique search users
- Success and failure rates
- Top viewed Channels or Pages
- Top engaging posts
- MVP of content contributors
Review your intranet’s performance at your next board meeting? Download it as a .csv file or import your data from Happeo into another system – the sky's the limit.
For a complete introduction to Google Analytics 4, use this Google Analytics 4 account training guide.
Internal Communications Expert insights
